Continued global momentum delivered all-time high revenue and 15% Underlying EPS growth in FY24
BRUSSELS--(BUSINESS WIRE)--Anheuser-Busch InBev (Brussel:ABI) (BMV:ANB) (JSE:ANH) (NYSE:BUD):
Regulated and inside information1
“Beer is a passion point for consumers and a vibrant category globally. The strength of our 2024 results is a testament to the consistent execution of our strategy and the hard work and dedication of our people. We delivered EBITDA growth at the top-end of our outlook and a step change in our free cash flow generation. We are investing for the long-term and are confident in our ability to lead and grow the category.” – Michel Doukeris, CEO, AB InBev
|
Total Revenue 4Q +3.4% | FY +2.7% Revenue increased by 3.4% in 4Q24 with revenue per hl growth of 5.5% and by 2.7% in FY24 with revenue per hl growth of 4.3%. Reported revenue increased by 2.5% in 4Q24 and by 0.7% in FY24 to 14 841 million USD and 59 768 million USD respectively, impacted by unfavorable currency translation.
Total Volume 4Q -1.9% | FY -1.4% In 4Q24, total volumes declined by 1.9%, with own beer volumes down by 2.1% and non-beer volumes down by 1.1%. In FY24, total volumes declined by 1.4% with own beer volumes down by 2.0% and non-beer volumes up by 1.5%.
Normalized EBITDA 4Q +10.1% | FY +8.2% In 4Q24, normalized EBITDA increased by 10.1% to 5 245 million USD with a normalized EBITDA margin expansion of 216bps to 35.3%. In FY24, normalized EBITDA increased by 8.2% to 20 958 million USD with a normalized EBITDA margin expansion of 179bps to 35.1%.
|
Underlying Profit (million USD) 4Q 1 770 | FY 7 061 Underlying Profit (Profit attributable to equity holders of AB InBev excluding non-underlying items and the impact of hyperinflation) was 1 770 million USD in 4Q24 compared to 1 661 million USD in 4Q23 and was 7 061 million USD in FY24 compared to 6 158 million USD in FY23. Reported profit attributable to equity holders of AB InBev was 1 220 million USD in 4Q24 and 5 855 million USD in FY24 versus 1 891 million USD in 4Q23 and 5 341 million USD in FY23, negatively impacted by non-underlying items.
Underlying EPS (USD) 4Q 0.88 | FY 3.53 Underlying EPS was 0.88 USD in 4Q24, an increase from 0.82 USD in 4Q23 and was 3.53 USD in FY24, an increase from 3.05 USD in FY23.
Net Debt to EBITDA 2.89x Net debt to normalized EBITDA ratio was 2.89x at 31 December 2024, compared to 3.38x at 31 December 2023. |
|
Capital Allocation Dividend 1.00 EUR The AB InBev Board proposes a full year 2024 dividend of 1.00 EUR per share, subject to shareholder approval at the AGM on 30 April 2025. A timeline showing the ex-dividend, record and payment dates can be found on page 16. Out of the two billion USD share buyback program announced on 31 October 2024, approximately 750 million USD was completed as of 21 February 2025. |
|
The 2024 Full Year Financial Report is available on our website at www.ab-inbev.com
|
1The enclosed information constitutes inside information as defined in Regulation (EU) No 596/2014 of the European Parliament and of the Council of 16 April 2014 on market abuse, and regulated information as defined in the Belgian Royal Decree of 14 November 2007 regarding the duties of issuers of financial instruments which have been admitted for trading on a regulated market. For important disclaimers and notes on the basis of preparation, please refer to page 17. |
Management comments
Consistent execution of our strategy
We made consistent progress across the 3 pillars of our strategy in 2024 and delivered another year of reliable compounding growth. The combination of our megabrands, mega platforms and our focus on innovation to meet consumer trends with both balanced choices and superior value is a winning proposition. While our overall volume performance this year was constrained by the soft consumer environments in China and Argentina, the global beer category remains vibrant with our volumes growing in the majority of our markets and by 0.9% overall when excluding these two countries.
We advanced our digital transformation, with 75% of our revenue now transacted through B2B digital platforms. The momentum of BEES marketplace accelerated, with the gross merchandise value (GMV) growing by 57% versus FY23 to reach 2.5 billion USD.
As we continue to optimize our business we delivered a high-quality set of financial results. USD revenues increased to an all-time high, EBITDA grew at the top-end of our outlook, Underlying EPS increased by 15.4% in USD and free cash flow generation increased by 2.5 billion USD. We enhanced the efficiency of our resource allocation and delivered an important milestone in our capital allocation journey with our net debt to EBITDA ratio reaching 2.89x as of 31 December 2024, below 3x for the first time since 2015.
The beer category is large and profitable, continues to gain share of alcohol globally and our footprint has structural tailwinds for long-term volume growth with favorable demographics, economic growth and opportunities to increase category participation.
Continued global momentum
Our top-line increased by 2.7% in FY24, with revenue growth in 75% of our markets. Revenue per hl increased by 4.3%, accelerating sequentially through the year, as we continued to make disciplined revenue management choices and drive premiumization, while investing in our brands to provide value to our consumers. Excluding China and Argentina our volumes globally grew by 0.9% but overall performance was significantly constrained by these two countries, resulting in a total volume decline of 1.4%.
EBITDA increased by 8.2% with production cost efficiencies and disciplined overhead management driving EBITDA margin expansion of 179bps. Underlying EPS was 3.53 USD, a 15.4% increase versus FY23, driven primarily by USD EBIT growth and optimization of our net finance costs.
Progressing our strategic priorities
-
Lead and grow the category
In FY24, we invested 7.2 billion USD in sales and marketing behind our megabrands, mega platforms and brand building capabilities to lead the long-term growth of the global beer category. The beer and Beyond Beer category continued to gain share of total alcohol globally with further growth projected over the next 5 years, according to IWSR. We estimate that we gained or maintained share in two thirds of our markets, with our megabrands, which represent 57% of our revenue, leading our growth with a 4.6% revenue increase.
Our unparalleled portfolio holds 20 iconic billion-dollar revenue beer brands and 8 out of the top 10 most valuable beer brands in the world, with Corona and Budweiser the #1 and #2, according to Kantar BrandZ. We successfully activated our portfolio in some of the largest consumer moments such as the Olympics, NBA, Copa America, Lollapalooza, Wimbledon and the Super Bowl, driving an increase in our overall portfolio brand power.
Our marketing effectiveness and creativity was recognized by again being named the most effective marketer in the world by both Effies and the World Advertising Research Center and being the most awarded beverage company at the 2024 Cannes Lions International Festival of Creativity.- Category Participation: Investments in our megabrands and innovations drove an estimated increase in the percentage of beer consumers purchasing our portfolio globally of approximately 90 basis points. Participation increases were driven by improvements with all consumer groups in the US and with new legal drinking age consumers (LDA-24 years old) in 65% of our markets.
- Core Superiority: Our mainstream beer portfolio represented approximately 50% of our FY24 revenue and delivered low-single digit revenue growth, with increases in 60% of our markets, including high-single digit growth in South Africa and Colombia.
- Occasions Development: We continue to focus on innovating to expand occasions and meet consumer trends. Our portfolio includes options for consumers seeking balanced choices such as low carb, organic, sugar free, gluten free and no-alcohol brands. In no-alcohol beer, our portfolio delivered a low-twenties revenue increase in FY24 and is estimated to have gained share globally, led by Corona Cero which delivered triple-digit volume growth. We are the leader in no-alcohol beer in many of our key markets, including the US, Brazil and Belgium, and see significant headroom for future growth.
- Premiumization: We are the global leader in premium and super premium beer. Our above core beer portfolio represented 35% of our FY24 revenue and grew revenue by low-single digits. Corona led our performance, increasing revenue by low-teens outside of Mexico with double-digit volume growth in more than 30 markets. In the US, Michelob Ultra led our growth and was the #1 volume share gaining brand in the industry in 2H24. In Brazil, Budweiser was the #1 volume share gaining brand in the industry with volumes increasing by nearly 50%.
- Beyond Beer: In FY24, our Beyond Beer business represented 2% of our revenue and grew revenue by low-single digits led by double-digit growth in key brands such as Cutwater, Nütrl and Brutal Fruit.
-
Digitize and monetize our ecosystem
We continued to progress our digital transformation by expanding the availability and usage of BEES, accelerating the growth of BEES Marketplace and scaling our digital DTC megabrands.- Digitizing our relationships with our more than six million customers globally: As of 31 December 2024, BEES was live in 28 markets, with 75% of our revenues captured through B2B digital platforms. In FY24, BEES captured 49 billion USD in GMV, growth of 19% versus FY23.
- Monetizing our route-to-market: BEES Marketplace generated 36 million orders and captured 2.5 billion USD in GMV from sales of third-party products this year, growth of 31% and 57% versus FY23 respectively.
- Leading the way in DTC solutions: Our omnichannel DTC ecosystem of digital and physical products generated revenue of 1.4 billion USD this year. Our DTC megabrands, Zé Delivery, TaDa Delivery and PerfectDraft are available in 21 markets, generated over 76 million e-commerce orders and delivered 560 million USD of revenue in FY24, growth of 9% versus FY23.
-
Optimize our business
-
Maximizing value creation: We enhanced our resource allocation efficiency this year, optimizing our net capex from 4.5 billion USD in FY23 to 3.7 billion USD in FY24 while continuing to invest in our facilities, digital transformation and growth priorities. Increased capex efficiency, USD EBITDA growth and the optimization of our net working capital and finance costs drove strong growth in our free cash flow generation, reaching 11.3 billion USD in FY24, a 2.5 billion USD increase versus FY23.
We continued to proactively manage our debt portfolio in FY24 with bond repurchases of 9 billion USD and issuances of 5 billion USD strengthening our debt maturity profile while maintaining our average coupon. We reduced net debt by 6.9 billion USD to reach 60.6 billion USD, resulting in a net debt to EBITDA ratio of 2.89x as of 31 December 2024, below 3.0x for the first time since 2015.
The AB InBev Board of Directors has proposed a full year dividend of 1.00 EUR per share, a 22% increase versus FY23, with the ambition to continue a progressive dividend over time. In addition, as of 21 February 2025 we have completed 750 million USD of our 2 billion USD share buyback program announced on 31 October 2024.
-
Advancing our sustainability priorities: In FY24, we contracted the equivalent of 100% of our global purchased electricity volume from renewable sources with 81.2% operational. Since 2017, we reduced our absolute GHG emissions across Scopes 1 and 2 by 42% and GHG emissions intensity across Scopes 1, 2 and 3 by 29.5%. In sustainable agriculture, 100% of our direct farmers met our criteria for skilled, connected and financially empowered. In water stewardship, 89% of sites in scope for our 2025 goal are already seeing improvement in watershed health. Our water use efficiency ratio improved to 2.47 hl per hl, an improvement of 20% versus a 2017 baseline. For circular packaging, 89.8% of our products were in packaging that was returnable or made from majority recycled content.
We have supported responsible drinking for decades and have invested over 1 billion USD in responsibility programs across the globe since 2016. We continue to promote beer as the beverage for moderation and provide choices for consumers, including no alcohol and low alcohol beers.
Please refer to our Sustainability Statements in our 2024 annual report here for further details, including how our metrics are calculated and the related assumptions.
-
Maximizing value creation: We enhanced our resource allocation efficiency this year, optimizing our net capex from 4.5 billion USD in FY23 to 3.7 billion USD in FY24 while continuing to invest in our facilities, digital transformation and growth priorities. Increased capex efficiency, USD EBITDA growth and the optimization of our net working capital and finance costs drove strong growth in our free cash flow generation, reaching 11.3 billion USD in FY24, a 2.5 billion USD increase versus FY23.
Delivering reliable compounding growth
2024 also marked three years since we introduced our 3-pillar strategy and medium-term growth ambition and reoriented the business to drive long-term value creation through organic growth. While the operating environment over this time has been dynamic, we are encouraged when we look back and evaluate the resilience of our business, consistency of our performance and the progress we have made in the execution of our strategy.
Since FY21, we have increased our revenue by 5.5 billion USD, EBITDA by 1.7 billion USD and free cash flow by 2.0 billion USD. Our Underlying EPS has increased by a CAGR of 7% in USD. Our financial performance has been consistent, with organic EBITDA growth within or above our medium-term growth ambition in every quarter over the last 3 years. We have been disciplined in our capital allocation choices, reducing net debt by 15.5 billion USD to reach 2.89x net debt to EBITDA, progressively increased our dividend each year and announced 3.2 billion USD of share buybacks. We have advanced our digital transformation, with the GMV captured by BEES more than doubling from approximately 20 billion USD in FY21 to 49 billion USD in FY24, and we have built a fast-growing Marketplace of third-party products from a standing start to a 2.5 billion USD GMV business.
We are encouraged by the progress we have made over the last three years and will continue to work towards consistently compounding our growth over the long-term to unlock our full value creation potential. Our performance would not have been possible without the hard work and dedication of our people and we thank our colleagues globally for their passion and commitment.
Looking forward
Looking ahead to 2025, we are committed to investing for long-term growth. While the operating environment remains dynamic in certain markets, we are confident in our ability to deliver on our outlook and energized about the opportunities ahead to grow the category. Consumers are passionate about beer and our iconic brands. We are well-positioned to lead category growth with our industry-leading portfolio of beer, beyond beer and no-alcohol beverages, diversified geographic footprint and unique leadership advantages.
2025 Outlook
(i) Overall Performance: We expect our EBITDA to grow in line with our medium-term outlook of between 4-8%. The outlook for FY25 reflects our current assessment of inflation and other macroeconomic conditions.
(ii) Net Finance Costs: Net pension interest expenses and accretion expenses are expected to be in the range of 190 to 220 million USD per quarter, depending on currency and interest rate fluctuations. We expect the average gross debt coupon in FY25 to be approximately 4%.
(iii) Effective Tax Rates (ETR): We expect the normalized ETR in FY25 to be in the range of 26% to 28%. The ETR outlook does not consider the impact of potential future changes in legislation.
(iv) Net Capital Expenditure: We expect net capital expenditure of between 3.5 and 4.0 billion USD in FY25.
|
Figure 1. Consolidated performance (million USD) |
||||||
|
4Q23 |
4Q24 |
Organic |
||||
|
growth |
||||||
|
Total Volumes (thousand hls) |
144 706 |
141 829 |
-1.9% |
|||
|
AB InBev own beer |
123 764 |
121 059 |
-2.1% |
|||
|
Non-beer volumes |
19 998 |
19 775 |
-1.1% |
|||
|
Third party products |
944 |
995 |
7.8% |
|||
|
Revenue |
14 473 |
14 841 |
3.4% |
|||
|
Gross profit |
7 794 |
8 197 |
6.3% |
|||
|
Gross margin |
53.9% |
55.2% |
153bps |
|||
|
Normalized EBITDA |
4 877 |
5 245 |
10.1% |
|||
|
Normalized EBITDA margin |
33.7% |
35.3% |
216bps |
|||
|
Normalized EBIT |
3 491 |
3 824 |
12.0% |
|||
|
Normalized EBIT margin |
24.1% |
25.8% |
199bps |
|||
|
|
||||||
|
Profit attributable to equity holders of AB InBev |
1 891 |
1 220 |
||||
|
Underlying profit attributable to equity holders of AB InBev |
1 661 |
1 770 |
||||
|
|
||||||
|
Earnings per share (USD) |
0.94 |
0.61 |
||||
|
Underlying earnings per share (USD) |
0.82 |
0.88 |
|
|||
|
FY23 |
FY24 |
Organic |
||||
|
growth |
||||||
|
Total Volumes (thousand hls) |
584 728 |
575 706 |
-1.4% |
|||
|
AB InBev own beer |
505 899 |
495 496 |
-2.0% |
|||
|
Non-beer volumes |
74 810 |
75 932 |
1.5% |
|||
|
Third party products |
4 019 |
4 278 |
7.0% |
|||
|
Revenue |
59 380 |
59 768 |
2.7% |
|||
|
Gross profit |
31 984 |
33 024 |
5.4% |
|||
|
Gross margin |
53.9% |
55.3% |
143bps |
|||
|
Normalized EBITDA |
19 976 |
20 958 |
8.2% |
|||
|
Normalized EBITDA margin |
33.6% |
35.1% |
179bps |
|||
|
Normalized EBIT |
14 590 |
15 462 |
9.4% |
|||
|
Normalized EBIT margin |
24.6% |
25.9% |
160bps |
|||
|
|
||||||
|
Profit attributable to equity holders of AB InBev |
5 341 |
5 855 |
||||
|
Underlying profit attributable to equity holders of AB InBev |
6 158 |
7 061 |
||||
|
|
||||||
|
Earnings per share (USD) |
2.65 |
2.92 |
||||
|
Underlying earnings per share (USD) |
3.05 |
3.53 |
|
|
Figure 2. Volumes (thousand hls) |
||||||||||||
|
4Q23 |
Scope |
Organic |
4Q24 |
Organic growth |
||||||||
|
growth |
Total |
Own beer |
||||||||||
|
North America |
19 738 |
- |
-223 |
19 516 |
-1.1% |
-0.8% |
||||||
|
Middle Americas |
38 635 |
-4 |
276 |
38 907 |
0.7% |
1.5% |
||||||
|
South America |
46 704 |
- |
-1 753 |
44 950 |
-3.8% |
-4.8% |
||||||
|
EMEA |
23 964 |
- |
919 |
24 883 |
3.8% |
2.9% |
||||||
|
Asia Pacific |
15 465 |
-75 |
-1 952 |
13 439 |
-12.7% |
-12.7% |
||||||
|
Global Export and Holding Companies |
200 |
-24 |
-41 |
135 |
-23.4% |
-28.0% |
||||||
|
AB InBev Worldwide |
144 706 |
- 103 |
-2 774 |
141 829 |
-1.9% |
-2.1% |
||||||
|
FY23 |
Scope |
Organic |
FY24 |
Organic growth |
||||||||
|
growth |
Total |
Own beer |
||||||||||
|
North America |
90 140 |
-470 |
-3 397 |
86 272 |
-3.8% |
-4.1% |
||||||
|
Middle Americas |
148 730 |
-18 |
1 373 |
150 086 |
0.9% |
1.4% |
||||||
|
South America |
162 460 |
- |
-1 692 |
160 768 |
-1.0% |
-2.1% |
||||||
|
EMEA |
90 213 |
- |
3 591 |
93 804 |
4.0% |
3.0% |
||||||
|
Asia Pacific |
92 726 |
-75 |
-8 255 |
84 397 |
-8.9% |
-8.9% |
||||||
|
Global Export and Holding Companies |
459 |
-24 |
-56 |
380 |
-12.8% |
-11.7% |
||||||
|
AB InBev Worldwide |
584 728 |
- 586 |
-8 435 |
575 706 |
-1.4% |
-2.0% |
||||||
Key Market Performances
United States: Increased investment driving momentum and improved market share trend, led by the #1 and #2 volume share growth brands in the industry in Q4
-
Operating performance:
- 4Q24: Revenue increased by 0.8% with revenue per hl increasing by 2.5% driven by revenue management initiatives and premiumization. Our sales-to-retailers increased by 0.5%, estimated to have outperformed the industry. Sales-to-wholesalers (STWs) declined by 1.7%. EBITDA declined by 0.2% as productivity initiatives and SG&A efficiencies were reinvested in increased marketing investments.
- FY24: Revenue declined by 2.0%, with revenue per hl increasing by 1.9%. Our STWs declined by 3.9%, supported by two additional selling-days in the year, and STRs were down by 5.0%. EBITDA increased by 2.2% with margin expansion of approximately 140bps.
- Commercial highlights: The beer industry remained resilient, improving in both volume and revenue trends sequentially since 2Q24 and gaining share of total alcohol by value in FY24, according to Circana. Our beer portfolio is estimated to have gained market share in 4Q24, driven by Michelob Ultra and Busch Light which were the #1 and #2 volume share gainers in the industry respectively. The momentum of our mainstream beer portfolio improved throughout the year, gaining share of the segment in both Q3 and Q4. We are the leader in no-alcohol beer and have seen strong consumer demand for Michelob Ultra Zero post its launch in January 2025. In Beyond Beer, the spirits-based ready-to-drink category accounted for 100% of the spirits industry’s value growth in FY24 with our portfolio outperforming the industry and delivering volume growth in the mid-teens, led by Cutwater and Nütrl. We continue to invest to rebalance our portfolio towards growing segments with our above core portfolio of beer and Beyond Beer brands representing approximately 45% of our revenue.
Mexico: Record high volumes with market share gain and margin expansion
-
Operating performance:
- 4Q24: Revenue grew by high-single digits, with mid-single digit revenue per hl growth driven by revenue management initiatives. Volumes grew by low-single digits, in-line with the industry, which returned to growth in an improved consumer environment. EBITDA grew by mid-teens with margin expansion.
- FY24: Revenue grew by mid-single digits with revenue per hl growth of low-single digits. Volumes increased by low-single digits, outperforming the industry. EBITDA grew by high-single digits with margin expansion.
- Commercial highlights: The momentum of our business continued in FY24, with our portfolio delivering record high volumes and continuing to gain share of the industry. Our performance was led by our core beer portfolio, which grew revenue by mid-single digits driven by Corona, while our above core beer brands continued to grow, delivering low-single digit revenue growth. We are leading the growth in no-alcohol beer with Corona Cero growing volume by strong double-digits. We continued to progress our digital initiatives, with BEES Marketplace growing GMV by 24% versus FY23 and our digital DTC platform, TaDa Delivery, increasing the number of orders by 21%.
Colombia: Record high volumes delivered double-digit top- and bottom-line growth
-
Operating performance:
- 4Q24: Revenue increased by high-single digits with mid-single digit revenue per hl growth, driven by revenue management initiatives. Volumes grew by low-single digits. EBITDA grew by mid-teens with margin expansion.
- FY24: Revenue grew by low-teens with high-single digit revenue per hl growth. Volumes increased by low-single digits. EBITDA grew by high-teens with margin expansion.
- Commercial highlights: Driven by the consistent execution of our category expansion levers, the beer category continues to grow, with our portfolio gaining 85 bps share of total alcohol this year and with our volumes reaching a new record high. Our performance was driven by our above core beer brands which delivered high-single digit volume growth, led by Corona and Stella Artois. Our mainstream beer portfolio continued to grow, delivering a low-single digit volume increase.
Brazil: Market share gain and margin expansion drove double-digit bottom-line growth
-
Operating performance:
- 4Q24: Revenue grew by 0.9% with revenue per hl growth of 3.8% driven by premiumization and revenue management initiatives. Total volumes declined by 2.8%, with beer volumes declining by 3.9%, estimated to have outperformed the industry which was impacted by adverse weather. Non-beer volumes were flat. EBITDA increased by 8.0% with margin expansion of 237bps.
- FY24: Revenue grew by 4.7% with a revenue per hl increase of 3.1%. Total volumes grew by 1.5% with beer volumes up by 0.6%, estimated to have outperformed the industry, and non-beer volumes up by 4.1%. EBITDA grew by 14.5% with 284bps of margin expansion.
- Commercial highlights: Our above core beer brands led our performance this year, delivering low-teens volume growth, driven by Budweiser and Corona. Within the core beer segment, the momentum of Brahma continued with a mid-single digit volume increase. We are the leader in no-alcohol beer, with our volumes growing by double-digits, led by Budweiser Zero and Corona Cero. Non-beer performance was led by our low- and no-sugar portfolio, which grew volumes in the low-twenties. We continued to progress our digital initiatives, with BEES Marketplace growing GMV by 47% versus FY23, and our digital DTC platform, Zé Delivery, generating over 66 million orders in FY24, a 10% increase versus last year.
Europe: Market share gain and margin recovery drove double-digit bottom-line growth
-
Operating performance:
- 4Q24: Revenue declined by low-single digits with low-single digit revenue per hl growth driven by continued premiumization. Volumes declined by mid-single digits, estimated to be in-line or outperforming a soft industry across the majority of our key markets. EBITDA grew by approximately 20% with margin recovery.
- FY24: Revenue and revenue per hl increased by low-single digits with slight volume growth, outperforming the industry in 5 of our 6 key markets according to our estimates. EBITDA grew by mid-teens with margin recovery driven by top-line growth and cost efficiencies.
- Commercial highlights: The beer category remained resilient in FY24, estimated to have gained share of total alcohol in 5 of our 6 key markets and with our own volumes growing year-on-year. We continued to premiumize our portfolio, with our premium and super premium portfolio making up approximately 57% of our FY24 revenue. Our performance this year was driven by our megabrands, Corona and Stella Artois, which successfully activated the category in key moments such as the Olympic Games, Roland Garros and Wimbledon. In the UK, as of January 2025, we have strengthened our portfolio with the addition of the San Miguel brand and are now the leading brewer in the industry. In no-alcohol beer, we expanded the availability of Corona Cero to 27 markets, growing volumes by strong double-digits.
South Africa: Market share gain and margin expansion drove double digit top- and bottom-line growth
-
Operating performance:
- 4Q24: Revenue increased by low-teens with revenue per hl growth of low-single digits, driven by revenue management initiatives and continued premiumization. Volumes grew by low-teens, outperforming the industry according to our estimates, with increased production capacity enabling us to meet the strong consumer demand for our brands. EBITDA grew by high-single digits.
- FY24: Revenue increased by low-teens with mid-single digit revenue per hl growth. Volume grew by mid-single digits, estimated to have outperformed the industry in both beer and Beyond Beer. EBITDA increased by high-teens with margin expansion.
- Commercial highlights: The beer industry returned to volume growth in FY24 following a volume decline in FY23. The momentum of our business continued, with focused investments in our megabrands increasing the Brand Power of our portfolio and driving estimated market share gains in both beer and Beyond Beer. Our performance was led by our above core beer brands, which grew volumes by low-teens driven by Corona and Stella Artois, while our core beer portfolio continued to grow, delivering a mid-single digit volume increase. In Beyond Beer, our portfolio grew volumes by high-single digits driven by Brutal Fruit, Flying Fish and Redd’s.
China: Revenue declined by double-digits, impacted by soft industry
-
Operating performance:
- 4Q24: Volumes declined by 19.0%, underperforming a soft industry according to our estimates, with our performance impacted by inventory management, which accounted for approximately one third of our volume decline, and continued weakness in the on-premise channel. Revenue per hl decreased by 1.4%, driven by negative channel mix, resulting in a revenue decline of 20.1%. EBITDA declined by 8.9% with cost efficiencies partially offsetting top-line performance.
- FY24: Revenue declined by 13.1% with revenue per hl declining by 1.4% and volumes decreasing by 11.8%. EBITDA declined by 11.9% with margin expansion of 48bps.
- Commercial highlights: We remain focused on the execution of our strategy, centered on premiumization, channel and geographic expansion, and digital transformation. In FY24, our premium and super premium portfolio contributed approximately two-thirds of our revenue with Budweiser distribution now expanded to 235 cities. We continued to invest in our brands and innovations to provide balanced choices to our consumers with the expansion of zero sugar options. In the context of a soft on-premise channel, we accelerated our premiumization of the in-home channel with the expansion of our premium and super premium brands. The roll out and adoption of the BEES platform continued, as of December 2024, BEES is present in more than 320 cities with approximately 80% of our revenue generated through digital channels.
Highlights from our other markets
- Canada: Revenue grew by high-single digits this quarter with mid-single digit revenue per hl growth. Volumes grew by mid-single digits, outperforming an improved beer industry according to our estimates. Our performance was led by Michelob Ultra, Busch and Corona, which were three of the top five volume share gainers in the industry. In FY24, revenue declined by low-single digits with a revenue per hl increase of low-single digits driven by revenue management initiatives and premiumization. Volumes declined by low-single digits.
- Peru: Revenue and revenue per hl grew by mid-single digits this quarter, driven by revenue management initiatives. Volumes grew by low-single digits, estimated to be in-line with the industry, which returned to growth in an improving consumer environment. In FY24, revenue increased by low single-digits with revenue per hl growth of mid-single digits. Volumes declined by low-single digits outperforming a soft industry according to our estimates.
- Ecuador: Revenue grew by low-single digits in both 4Q24 and FY24, with performance led by our core beer portfolio which grew revenue by mid-single digits in both the quarter and the full year. Volumes declined by low-single digits in Q4 and were flat for FY24, estimated to be in-line with the industry which was negatively impacted by rolling blackouts and lower consumer confidence.
- Argentina: Volumes declined by mid-teens in 4Q24 and by high-teens in FY24, estimated to be in-line with the industry, as overall consumer demand was impacted by inflationary pressures. For FY24, the definition of organic revenue growth in Argentina has been amended to cap the price growth to a maximum of 2% per month. Revenue grew by low-teens in 4Q24 and by mid-single digits in FY24 on this basis.
-
Africa excluding South Africa: In Nigeria, revenue grew by strong double-digits in both 4Q24 and FY24, driven by revenue management initiatives in a highly inflationary environment. Beer volumes grew by mid-single digits in 4Q24 and by low-teens in FY24, cycling a soft industry.
In our other markets, we grew volume in aggregate by low-single digits in 4Q24 and by mid-single digits in FY24, driven by Tanzania, Zambia, Botswana and Ghana. - South Korea: Revenue increased by high-single digits in 4Q24 with low-single digit revenue per hl growth. Driven by our core portfolio and innovations, volumes increased by high-single digits in 4Q24 and by mid-single digits in FY24, outperforming the industry in both the on-premise and in-home channels and reaching our highest market share in the last 10 years. Revenue increased by low-teens in FY24 with high-single digit revenue per hl growth, driven by revenue management initiatives and positive mix.
Consolidated Income Statement
|
Figure 3. Consolidated income statement (million USD) |
||||||
|
4Q23 |
4Q24 |
Organic |
||||
|
growth |
||||||
|
Revenue |
14 473 |
14 841 |
3.4% |
|||
|
Cost of sales |
-6 679 |
-6 645 |
0.0% |
|||
|
Gross profit |
7 794 |
8 197 |
6.3% |
|||
|
SG&A |
-4 537 |
-4 603 |
-1.7% |
|||
|
Other operating income/(expenses) |
234 |
231 |
-2.3% |
|||
|
Normalized profit from operations (normalized EBIT) |
3 491 |
3 824 |
12.0% |
|||
|
Non-underlying items above EBIT (incl. impairment losses) |
-165 |
269 |
||||
|
Net finance income/(cost) |
-1 290 |
-958 |
||||
|
Non-underlying net finance income/(cost) |
550 |
-701 |
||||
|
Share of results of associates |
95 |
103 |
||||
|
Non-underlying share of results of associates |
-35 |
- |
||||
|
Income tax expense |
-376 |
-848 |
||||
|
Profit |
2 270 |
1 691 |
||||
|
Profit attributable to non-controlling interest |
379 |
471 |
||||
|
Profit attributable to equity holders of AB InBev |
1 891 |
1 220 |
||||
|
|
||||||
|
Normalized EBITDA |
4 877 |
5 245 |
10.1% |
|||
|
Underlying profit attributable to equity holders of AB InBev |
1 661 |
1 770 |
||||
|
FY23 |
FY24 |
Organic |
||||
|
growth |
||||||
|
Revenue |
59 380 |
59 768 |
2.7% |
|||
|
Cost of sales |
-27 396 |
-26 744 |
0.5% |
|||
|
Gross profit |
31 984 |
33 024 |
5.4% |
|||
|
SG&A |
-18 172 |
-18 341 |
-2.0% |
|||
|
Other operating income/(expenses) |
778 |
779 |
-0.3% |
|||
|
Normalized profit from operations (normalized EBIT) |
14 590 |
15 462 |
9.4% |
|||
|
Non-underlying items above EBIT (incl. impairment losses) |
-624 |
25 |
||||
|
Net finance income/(cost) |
-5 033 |
-4 358 |
||||
|
Non-underlying net finance income/(cost) |
-69 |
-995 |
||||
|
Share of results of associates |
295 |
329 |
||||
|
Non-underlying share of results of associates |
-35 |
104 |
||||
|
Income tax expense |
-2 234 |
-3 152 |
||||
|
Profit |
6 891 |
7 416 |
||||
|
Profit attributable to non-controlling interest |
1 550 |
1 561 |
||||
|
Profit attributable to equity holders of AB InBev |
5 341 |
5 855 |
||||
|
|
||||||
|
Normalized EBITDA |
19 976 |
20 958 |
8.2% |
|||
|
Underlying profit attributable to equity holders of AB InBev |
6 158 |
7 061 |
||||
In FY24, Ambev recognized 49 million USD income in other operating income related to tax credits (FY23: 44 million USD). The year-over-year change is presented as a scope change and does not affect the presented organic growth rates.
Non-underlying items above EBIT & Non-underlying share of results of associates
|
Figure 4. Non-underlying items above EBIT & Non-underlying share of results of associates (million USD) |
||||||||
|
4Q23 |
4Q24 |
FY23 |
FY24 |
|||||
|
Restructuring |
-64 |
-60 |
-142 |
-156 |
||||
|
Business and asset disposal (incl. impairment losses) |
-23 |
331 |
-385 |
183 |
||||
|
Claims and legal costs |
-66 |
- |
-85 |
- |
||||
|
AB InBev Efes related costs |
-12 |
-2 |
-12 |
-2 |
||||
|
Non-underlying items in EBIT |
-165 |
269 |
-624 |
25 |
||||
|
Non-underlying share of results of associates |
-35 |
- |
- 35 |
104 |
||||
EBIT excludes positive non-underlying items of 269 million USD in 4Q24 and 25 million USD in FY24. Business and asset disposal (including impairment losses) for FY24 mainly comprised a gain of 437 million USD recognized upon the sale of our share in associate Ghost Beverages LLC, partially offset by impairment losses of intangible assets and other non-core assets sold in the period.
Non-underlying share of results from associates of FY24 includes the impact from our associate Anadolu Efes’ adoption of IAS 29 hyperinflation accounting on their 2023 results.
Net finance income/(cost)
|
Figure 5. Net finance income/(cost) (million USD) |
||||||||
|
4Q23 |
4Q24 |
FY23 |
FY24 |
|||||
|
Net interest expense |
-712 |
-667 |
-3 131 |
-2 846 |
||||
|
Net interest on net defined benefit liabilities |
-26 |
-21 |
-90 |
-89 |
||||
|
Accretion expense |
-228 |
-177 |
-808 |
-722 |
||||
|
Net interest income on Brazilian tax credits |
61 |
47 |
168 |
142 |
||||
|
Other financial results |
-385 |
-139 |
-1 172 |
-843 |
||||
|
Net finance income/(cost) |
-1 290 |
- 958 |
-5 033 |
-4 358 |
||||
Non-underlying net finance income/(cost)
|
Figure 6. Non-underlying net finance income/(cost) (million USD) |
||||||||
|
4Q23 |
4Q24 |
FY23 |
FY24 |
|||||
|
Mark-to-market |
294 |
-940 |
-325 |
-1 211 |
||||
|
Gain/(loss) on bond redemption and other |
256 |
239 |
256 |
216 |
||||
|
Non-underlying net finance income/(cost) |
550 |
-701 |
-69 |
-995 |
||||
Non-underlying net finance cost in FY24 includes mark-to-market losses on derivative instruments entered into in order to hedge our share-based payment programs and shares issued in relation to the combination with Grupo Modelo and SAB.
The number of shares covered by the hedging of our share-based payment program, the deferred share instrument and the restricted shares are shown in figure 7, together with the opening and closing share prices.
|
Figure 7. Non-underlying equity derivative instruments |
||||||||
|
4Q23 |
4Q24 |
FY23 |
FY24 |
|||||
|
Share price at the start of the period (Euro) |
52.51 |
59.38 |
56.27 |
58.42 |
||||
|
Share price at the end of the period (Euro) |
58.42 |
48.25 |
58.42 |
48.25 |
||||
|
Number of equity derivative instruments at the end of the period (millions) |
100.5 |
100.5 |
100.5 |
100.5 |
||||
Income tax expense
|
Figure 8. Income tax expense (million USD) |
||||||||
|
4Q23 |
4Q24 |
FY23 |
FY24 |
|||||
|
Income tax expense |
376 |
848 |
2 234 |
3 152 |
||||
|
Effective tax rate |
14.5% |
34.8% |
25.2% |
31.1% |
||||
|
Normalized effective tax rate |
16.7% |
26.4% |
24.3% |
26.5% |
||||
The FY23, 4Q24 and FY24 effective tax rates were negatively impacted by non-deductible losses from derivatives related to the hedging of share-based payment programs and of the shares issued in a transaction related to the combination with Grupo Modelo and SAB, while the 4Q23 effective tax rate was positively impacted by non-taxable gains from these derivatives.
The increase in normalized ETR in 4Q24 compared to 4Q23 and the increase in FY24 compared to FY23 is driven mainly by changes in tax legislation in Brazil effective 1 January 2024, partially offset by country mix.
|
Figure 9. Underlying Profit attributable to equity holders of AB InBev (million USD) |
||||||||
|
4Q23 |
4Q24 |
FY23 |
FY24 |
|||||
|
Profit attributable to equity holders of AB InBev |
1 891 |
1 220 |
5 341 |
5 855 |
||||
|
Net impact of non-underlying items on profit |
-360 |
520 |
614 |
1 062 |
||||
|
Hyperinflation impacts in underlying profit |
130 |
31 |
203 |
145 |
||||
|
Underlying profit attributable to equity holders of AB InBev |
1 661 |
1 770 |
6 158 |
7 061 |
||||
Basic and Underlying EPS
|
Figure 10. Earnings per share (USD) |
||||||||
|
4Q23 |
4Q24 |
FY23 |
FY24 |
|||||
|
Basic EPS |
0.94 |
0.61 |
2.65 |
2.92 |
||||
|
Net impact of non-underlying items on profit |
-0.18 |
0.26 |
0.31 |
0.53 |
||||
|
Hyperinflation impacts in EPS |
0.06 |
0.02 |
0.10 |
0.07 |
||||
|
Underlying EPS |
0.82 |
0.88 |
3.05 |
3.53 |
||||
|
Weighted average number of ordinary and restricted shares (million) |
2 016 |
2 003 |
2 016 |
2 003 |
||||
|
Figure 11. Key components - Underlying EPS in USD |
||||||||
|
4Q23 |
4Q24 |
FY23 |
FY24 |
|||||
|
Normalized EBIT before hyperinflation |
1.86 |
1.93 |
7.42 |
7.77 |
||||
|
Hyperinflation impacts in normalized EBIT |
-0.13 |
-0.02 |
-0.18 |
-0.05 |
||||
|
Normalized EBIT |
1.73 |
1.91 |
7.24 |
7.72 |
||||
|
Net finance cost |
-0.64 |
-0.48 |
-2.50 |
-2.18 |
||||
|
Income tax expense |
-0.18 |
-0.38 |
-1.15 |
-1.47 |
||||
|
Associates & non-controlling interest |
-0.15 |
-0.18 |
-0.64 |
-0.62 |
||||
|
Hyperinflation impacts in EPS |
0.06 |
0.02 |
0.10 |
0.07 |
||||
|
Underlying EPS |
0.82 |
0.88 |
3.05 |
3.53 |
||||
|
Weighted average number of ordinary and restricted shares (million) |
2 016 |
2 003 |
2 016 |
2 003 |
||||
Reconciliation between normalized EBITDA and profit attributable to equity holders
|
Figure 12. Reconciliation of normalized EBITDA to profit attributable to equity holders of AB InBev (million USD) |
||||||||
|
4Q23 |
4Q24 |
FY23 |
FY24 |
|||||
|
Profit attributable to equity holders of AB InBev |
1 891 |
1 220 |
5 341 |
5 855 |
||||
|
Non-controlling interests |
379 |
471 |
1 550 |
1 561 |
||||
|
Profit |
2 270 |
1 691 |
6 891 |
7 416 |
||||
|
Income tax expense |
376 |
848 |
2 234 |
3 152 |
||||
|
Share of result of associates |
-95 |
-103 |
-295 |
-329 |
||||
|
Non-underlying share of results of associates |
35 |
- |
35 |
-104 |
||||
|
Net finance (income)/cost |
1 290 |
958 |
5 033 |
4 358 |
||||
|
Non-underlying net finance (income)/cost |
-550 |
701 |
69 |
995 |
||||
|
Non-underlying items above EBIT (incl. impairment losses) |
165 |
-269 |
624 |
-25 |
||||
|
Normalized EBIT |
3 491 |
3 824 |
14 590 |
15 462 |
||||
|
Depreciation, amortization and impairment |
1 386 |
1 421 |
5 386 |
5 496 |
||||
|
Normalized EBITDA |
4 877 |
5 245 |
19 976 |
20 958 |
||||
Normalized EBITDA and normalized EBIT are measures utilized by AB InBev to demonstrate the company’s underlying performance.
Normalized EBITDA is calculated excluding the following effects from profit attributable to equity holders of AB InBev: (i) non-controlling interest; (ii) income tax expense; (iii) share of results of associates; (iv) non-underlying share of results of associates; (v) net finance income or cost; (vi) non-underlying net finance income or cost; (vii) non-underlying items above EBIT; and (viii) depreciation, amortization and impairment.
Normalized EBITDA and normalized EBIT are not accounting measures under IFRS and should not be considered as an alternative to profit attributable to equity holders as a measure of operational performance, or an alternative to cash flow as a measure of liquidity. Normalized EBITDA and normalized EBIT do not have a standard calculation method and AB InBev’s definition of normalized EBITDA and normalized EBIT may not be comparable to that of other companies.
Financial position
|
Figure 13. Cash Flow Statement (million USD) |
||||
|
FY23 |
FY24 |
|||
|
Operating activities |
||||
|
Profit of the period |
6 891 |
7 416 |
||
|
Interest, taxes and non-cash items included in profit |
14 181 |
13 990 |
||
|
Cash flow from operating activities before changes in working capital and use of provisions |
21 072 |
21 406 |
||
|
|
||||
|
Change in working capital |
-1 541 |
-22 |
||
|
Pension contributions and use of provisions |
-419 |
-374 |
||
|
Interest and taxes (paid)/received |
-5 975 |
-6 189 |
||
|
Dividends received |
127 |
234 |
||
|
Cash flow from/(used in) operating activities |
13 265 |
15 055 |
||
|
|
||||
|
Investing activities |
||||
|
Net capex |
-4 482 |
-3 735 |
||
|
Sale/(acquisition) of subsidiaries, net of cash disposed/ acquired of |
9 |
-46 |
||
|
Net proceeds from sale/(acquisition) of other assets |
83 |
523 |
||
|
Cash flow from/(used in) investing activities |
-4 390 |
-3 259 |
||
|
|
||||
|
Financing activities |
||||
|
Net (repayments of) / proceeds from borrowings |
-2 896 |
-3 830 |
||
|
Dividends paid |
-3 013 |
-2 672 |
||
|
Share buyback |
-362 |
-937 |
||
|
Payment of lease liabilities |
-780 |
-787 |
||
|
Derivative financial instruments |
-841 |
-431 |
||
|
Sale/(acquisition) of non-controlling interests |
-22 |
-435 |
||
|
Other financing cash flows |
-646 |
-763 |
||
|
Cash flow from/(used in) financing activities |
-8 560 |
-9 854 |
||
|
Net increase/(decrease) in cash and cash equivalents |
315 |
1 942 |
||
Our free cash flow (defined as cash flow from operating activities less net capex) increased by 2 537 million USD to reach 11 320 million USD. FY24 recorded an increase in cash and cash equivalents of 1 942 million USD compared to an increase of 315 million USD in FY23 with the following movements:
- Our cash flow from operating activities reached 15 055 million USD in FY24 compared to 13 265 million USD in FY23. The increase was driven by higher profit for the period and an improved cash flow impact from changes in working capital as a result of cycling the negative cash flow impact in 2023 from extended credit terms to our wholesalers in the US and lower payables from optimizing inventory purchases and net capex.
- Our cash outflow from investing activities was 3 259 million USD in FY24 compared to a cash outflow of 4 390 million USD in FY23. The decrease in the cash outflow from investing activities was mainly due to lower net capital expenditures in FY24 compared to FY23 and proceeds from the sale of our share in associate Ghost Beverages LLC. Out of the total FY24 capital expenditures, approximately 44% was used to improve the company’s production facilities while 40% was used for logistics and commercial investments and 16% was used for the purchase of hardware and software and improving administrative capabilities.
- Our cash outflow from financing activities amounted to 9 854 million USD in FY24, as compared to a cash outflow of 8 560 million USD in FY23. The increase is primarily driven by higher debt redemption and share buyback in FY24 compared to FY23, and the acquisition of additional non-controlling interests in Cervecería Nacional Dominicana S.A. for a net consideration of 0.3 billion USD.
Our net debt decreased to 60.6 billion USD as of 31 December 2024 from 67.6 billion USD as of 31 December 2023.
Our net debt to normalized EBITDA ratio was 2.89x as of 31 December 2024. Our optimal capital structure is a net debt to normalized EBITDA ratio of around 2x.
We continue to proactively manage our debt portfolio. After bond repurchases of 9 billion USD and issuances of 5 billion USD in FY24, 97% of our bond portfolio holds a fixed-interest rate, 47% is denominated in currencies other than USD and maturities are well-distributed across the next several years.
In addition to a very comfortable debt maturity profile and strong cash flow generation, as of 31 December 2024, we had total liquidity of 21.5 billion USD, which consisted of 10.1 billion USD available under committed long-term credit facilities and 11.4 billion USD of cash, cash equivalents and short-term investments in debt securities less bank overdrafts.
Proposed full year 2024 dividend
The AB InBev Board proposes a full year 2024 dividend of 1.00 EUR per share, subject to shareholder approval at the AGM on 30 April 2025. In line with the Company’s financial discipline and deleveraging objectives, the recommended dividend balances the Company’s capital allocation priorities and dividend policy while returning cash to shareholders. A timeline showing the ex-dividend, record and payment dates can be found below:
|
Dividend Timeline |
|||
|
Ex-dividend date |
Record Date |
Payment date |
|
|
Euronext |
6 May 2025 |
7 May 2025 |
8 May 2025 |
|
MEXBOL |
6 May 2025 |
7 May 2025 |
8 May 2025 |
|
JSE |
5 May 2025 |
7 May 2025 |
8 May 2025 |
|
NYSE (ADR program) |
6 May 2025 |
7 May 2025 |
6 June 2025 |
|
Restricted Shares |
6 May 2025 |
7 May 2025 |
8 May 2025 |
Notes
To facilitate the understanding of AB InBev’s underlying performance, the analyses of growth, including all comments in this press release, unless otherwise indicated, are based on organic growth and normalized numbers. In other words, financials are analyzed eliminating the impact of changes in currencies on translation of foreign operations, and scope changes. Since 1Q24, the definition of organic revenue growth has been amended to cap the price growth in Argentina to a maximum of 2% per month (26.8% year-over-year). Corresponding adjustments are made to all income statement related items in the organic growth calculations through scope changes. Scope changes also represent the impact of acquisitions and divestitures, the start or termination of activities or the transfer of activities between segments, curtailment gains and losses and year over year changes in accounting estimates and other assumptions that management does not consider as part of the underlying performance of the business. The organic growth of our global brands, Budweiser, Stella Artois, Corona and Michelob Ultra, excludes exports to Australia for which a perpetual license was granted to a third party upon disposal of the Australia operations in 2020. All references per hectoliter (per hl) exclude US non-beer activities. Whenever presented in this document, all performance measures (EBITDA, EBIT, profit, tax rate, EPS) are presented on a “normalized” basis, which means they are presented before non-underlying items. Non-underlying items are either income or expenses which do not occur regularly as part of the normal activities of the Company. They are presented separately because they are important for the understanding of the underlying sustainable performance of the Company due to their size or nature. Normalized measures are additional measures used by management and should not replace the measures determined in accordance with IFRS as an indicator of the Company’s performance. We are reporting the results from Argentina applying hyperinflation accounting since 3Q18. The IFRS rules (IAS 29) require us to restate the year-to-date results for the change in the general purchasing power of the local currency, using official indices before converting the local amounts at the closing rate of the period. In FY24, we reported a negative impact from hyperinflation accounting on the profit attributable to equity holders of AB InBev of 145 million USD. The impact in FY24 Basic EPS was -0.07 USD. Values in the figures and annexes may not add up, due to rounding. 4Q24 and FY24 EPS is based upon a weighted average of 2 003 million shares compared to a weighted average of 2 016 million shares for 4Q23 and FY23.
Legal disclaimer
This release contains “forward-looking statements”. These statements are based on the current expectations and views of future events and developments of the management of AB InBev and are naturally subject to uncertainty and changes in circumstances. The forward-looking statements contained in this release include statements other than historical facts and include statements typically containing words such as “will”, “may”, “should”, “believe”, “intends”, “expects”, “anticipates”, “targets”, “ambition”, “estimates”, “likely”, “foresees” and words of similar import. All statements other than statements of historical facts are forward-looking statements. You should not place undue reliance on these forward-looking statements, which reflect the current views of the management of AB InBev, are subject to numerous risks and uncertainties about AB InBev and are dependent on many factors, some of which are outside of AB InBev’s control. There are important factors, risks and uncertainties that could cause actual outcomes and results to be materially different, including, but not limited to the risks and uncertainties relating to AB InBev that are described under Item 3.D of AB InBev’s Annual Report on Form 20-F filed with the SEC on 11 March 2024. Many of these risks and uncertainties are, and will be, exacerbated by any further worsening of the global business and economic environment, including as a result of foreign currency exchange rate fluctuations and ongoing geopolitical conflicts. Other unknown or unpredictable factors could cause actual results to differ materially from those in the forward-looking statements. The forward-looking statements should be read in conjunction with the other cautionary statements that are included elsewhere, including AB InBev’s most recent Form 20-F and other reports furnished on Form 6-K, and any other documents that AB InBev has made public. Any forward-looking statements made in this communication are qualified in their entirety by these cautionary statements and there can be no assurance that the actual results or developments anticipated by AB InBev will be realized or, even if substantially realized, that they will have the expected consequences to, or effects on, AB InBev or its business or operations. Except as required by law, AB InBev undertakes no obligation to publicly update or revise any forward-looking statements, whether as a result of new information, future events or otherwise. The full year 2024 (FY24) financial data set out in Figure 1 (except for the volume information), Figures 3 to 5, 6, 8, 9,12 and 13 of this press release have been extracted from the group’s audited consolidated financial statements as of and for the twelve months ended 31 December 2024, which have been audited by our statutory auditors PwC Réviseurs d’Entreprises SRL / PwC Bedrijfsrevisoren BV. The fourth quarter 2024 (4Q24) financial data set out in Figure 1 (except for the volume information), Figures 3 to 5, 6, 8, 9, 12 and 13 and the financial data included in Figures 7, 10, 11 and 14 have been extracted from the underlying accounting records as of and for the twelve months ended 31 December 2024. References in this document to materials on our websites, such as www.ab-inbev.com, are included as an aid to their location and are not incorporated by reference into this document.
Conference call and webcast
Investor Conference call and webcast on Wednesday, 26 February 2025:
1.00pm Brussels / 12.00pm London / 7.00am New York
Registration details:
Webcast (listen-only mode):
AB InBev 4Q24 Results Webcast
To join by phone, please use one of the following two phone numbers:
Toll-Free: +1-877-407-8029
Toll: +1-201-689-8029
About AB InBev
Anheuser-Busch InBev (AB InBev) is a publicly traded company (Euronext: ABI) based in Leuven, Belgium, with secondary listings on the Mexico (MEXBOL: ANB) and South Africa (JSE: ANH) stock exchanges and with American Depositary Receipts on the New York Stock Exchange (NYSE: BUD). As a company, we dream big to create a future with more cheers. We are always looking to serve up new ways to meet life’s moments, move our industry forward and make a meaningful impact in the world. We are committed to building great brands that stand the test of time and to brewing the best beers using the finest ingredients. Our diverse portfolio of well over 500 beer brands includes global brands Budweiser®, Corona®, Stella Artois® and Michelob Ultra®; multi-country brands Beck’s®, Hoegaarden® and Leffe®; and local champions such as Aguila®, Antarctica®, Bud Light®, Brahma®, Cass®, Castle®, Castle Lite®, Cristal®, Harbin®, Jupiler®, Modelo Especial®, Quilmes®, Victoria®, Sedrin®, and Skol®. Our brewing heritage dates back more than 600 years, spanning continents and generations. From our European roots at the Den Hoorn brewery in Leuven, Belgium. To the pioneering spirit of the Anheuser & Co brewery in St. Louis, US. To the creation of the Castle Brewery in South Africa during the Johannesburg gold rush. To Bohemia, the first brewery in Brazil. Geographically diversified with a balanced exposure to developed and developing markets, we leverage the collective strengths of approximately 144 000 colleagues based in nearly 50 countries worldwide. For 2024, AB InBev’s reported revenue was 59.8 billion USD (excluding JVs and associates).
Annex 1: Segment reporting (4Q)
|
AB InBev Worldwide |
4Q23 |
Scope |
Currency Translation |
Organic Growth |
4Q24 |
Organic Growth |
||||||
|
Total volumes (thousand hls) |
144 706 |
-103 |
- |
-2 774 |
141 829 |
-1.9% |
||||||
|
of which AB InBev own beer |
123 764 |
-77 |
- |
-2 628 |
121 059 |
-2.1% |
||||||
|
Revenue |
14 473 |
-1 030 |
905 |
493 |
14 841 |
3.4% |
||||||
|
Cost of sales |
-6 679 |
633 |
-600 |
1 |
-6 645 |
0.0% |
||||||
|
Gross profit |
7 794 |
-397 |
305 |
494 |
8 197 |
6.3% |
||||||
|
SG&A |
-4 537 |
375 |
-365 |
-76 |
-4 603 |
-1.7% |
||||||
|
Other operating income/(expenses) |
234 |
11 |
-11 |
-4 |
231 |
-2.3% |
||||||
|
Normalized EBIT |
3 491 |
-11 |
-70 |
414 |
3 824 |
12.0% |
||||||
|
Normalized EBITDA |
4 877 |
-136 |
17 |
487 |
5 245 |
10.1% |
||||||
|
Normalized EBITDA margin |
33.7% |
35.3% |
216bps |
|||||||||
|
|
||||||||||||
|
North America |
4Q23 |
Scope |
Currency Translation |
Organic Growth |
4Q24 |
Organic Growth |
||||||
|
Total volumes (thousand hls) |
19 738 |
- |
- |
-223 |
19 516 |
-1.1% |
||||||
|
Revenue |
3 283 |
- |
-6 |
54 |
3 331 |
1.7% |
||||||
|
Cost of sales |
-1 442 |
-4 |
2 |
-39 |
-1 483 |
-2.7% |
||||||
|
Gross profit |
1 841 |
-4 |
-4 |
15 |
1 848 |
0.8% |
||||||
|
SG&A |
-1 098 |
-4 |
2 |
22 |
-1 078 |
2.0% |
||||||
|
Other operating income/(expenses) |
18 |
- |
- |
-10 |
8 |
-57.4% |
||||||
|
Normalized EBIT |
761 |
-9 |
-1 |
26 |
777 |
3.5% |
||||||
|
Normalized EBITDA |
957 |
-9 |
-2 |
22 |
969 |
2.3% |
||||||
|
Normalized EBITDA margin |
29.2% |
29.1% |
18bps |
|||||||||
|
|
||||||||||||
|
Middle Americas |
4Q23 |
Scope |
Currency Translation |
Organic Growth |
4Q24 |
Organic Growth |
||||||
|
Total volumes (thousand hls) |
38 635 |
-4 |
- |
276 |
38 907 |
0.7% |
||||||
|
Revenue |
4 437 |
14 |
-348 |
292 |
4 395 |
6.6% |
||||||
|
Cost of sales |
-1 731 |
1 |
125 |
4 |
-1 601 |
0.2% |
||||||
|
Gross profit |
2 706 |
15 |
-222 |
296 |
2 794 |
10.9% |
||||||
|
SG&A |
-934 |
-35 |
83 |
-88 |
-975 |
-9.2% |
||||||
|
Other operating income/(expenses) |
27 |
- |
-1 |
-18 |
8 |
-66.3% |
||||||
|
Normalized EBIT |
1 799 |
-20 |
-141 |
189 |
1 828 |
10.6% |
||||||
|
Normalized EBITDA |
2 170 |
-35 |
-176 |
268 |
2 227 |
12.5% |
||||||
|
Normalized EBITDA margin |
48.9% |
50.7% |
267bps |
|||||||||
|
|
||||||||||||
|
South America |
4Q23 |
Scope |
Currency Translation |
Organic Growth |
4Q24 |
Organic Growth |
||||||
|
Total volumes (thousand hls) |
46 704 |
- |
- |
-1 753 |
44 950 |
-3.8% |
||||||
|
Revenue |
3 084 |
-998 |
1 287 |
100 |
3 473 |
3.2% |
||||||
|
Cost of sales |
-1 450 |
616 |
-759 |
35 |
-1 558 |
2.4% |
||||||
|
Gross profit |
1 635 |
-381 |
527 |
135 |
1 915 |
8.2% |
||||||
|
SG&A |
-890 |
371 |
-450 |
-24 |
-992 |
-2.7% |
||||||
|
Other operating income/(expenses) |
119 |
9 |
-13 |
19 |
133 |
25.5% |
||||||
|
Normalized EBIT |
863 |
-1 |
64 |
130 |
1 056 |
15.5% |
||||||
|
Normalized EBITDA |
1 106 |
-107 |
189 |
122 |
1 310 |
11.3% |
||||||
|
Normalized EBITDA margin |
35.8% |
37.7% |
273bps |
|
EMEA |
4Q23 |
Scope |
Currency Translation |
Organic Growth |
4Q24 |
Organic Growth |
||||||
|
Total volumes (thousand hls) |
23 964 |
- |
- |
919 |
24 883 |
3.8% |
||||||
|
Revenue |
2 252 |
6 |
-30 |
196 |
2 424 |
8.7% |
||||||
|
Cost of sales |
-1 253 |
-6 |
35 |
-52 |
-1 276 |
-4.1% |
||||||
|
Gross profit |
999 |
- |
5 |
145 |
1 149 |
14.5% |
||||||
|
SG&A |
-655 |
-13 |
-2 |
-38 |
-708 |
-5.7% |
||||||
|
Other operating income/(expenses) |
53 |
2 |
2 |
-5 |
51 |
-9.8% |
||||||
|
Normalized EBIT |
397 |
-11 |
5 |
101 |
493 |
25.5% |
||||||
|
Normalized EBITDA |
675 |
-11 |
2 |
110 |
776 |
16.3% |
||||||
|
Normalized EBITDA margin |
30.0% |
32.0% |
209bps |
|||||||||
|
|
||||||||||||
|
Asia Pacific |
4Q23 |
Scope |
Currency Translation |
Organic Growth |
4Q24 |
Organic Growth |
||||||
|
Total volumes (thousand hls) |
15 465 |
-75 |
- |
-1 952 |
13 439 |
-12.7% |
||||||
|
Revenue |
1 267 |
-9 |
2 |
-137 |
1 122 |
-10.9% |
||||||
|
Cost of sales |
-637 |
-5 |
- |
53 |
-589 |
8.2% |
||||||
|
Gross profit |
630 |
-14 |
2 |
-85 |
533 |
-13.7% |
||||||
|
SG&A |
-533 |
-15 |
4 |
60 |
-484 |
11.3% |
||||||
|
Other operating income/(expenses) |
26 |
- |
- |
8 |
33 |
29.3% |
||||||
|
Normalized EBIT |
122 |
-29 |
6 |
-17 |
83 |
-15.3% |
||||||
|
Normalized EBITDA |
288 |
-32 |
6 |
-18 |
244 |
-6.6% |
||||||
|
Normalized EBITDA margin |
22.8% |
21.7% |
104bps |
|||||||||
|
|
||||||||||||
|
Global Export and Holding Companies |
4Q23 |
Scope |
Currency Translation |
Organic Growth |
4Q24 |
Organic Growth |
||||||
|
Total volumes (thousand hls) |
200 |
-24 |
- |
-41 |
135 |
-23.4% |
||||||
|
Revenue |
150 |
-43 |
- |
-12 |
95 |
-10.8% |
||||||
|
Cost of sales |
-166 |
31 |
-3 |
1 |
-138 |
0.7% |
||||||
|
Gross profit |
-17 |
-12 |
-3 |
-11 |
-42 |
-36.6% |
||||||
|
SG&A |
-427 |
71 |
-2 |
-9 |
-367 |
-2.1% |
||||||
|
Other operating income/(expenses) |
-8 |
- |
1 |
4 |
-3 |
45.0% |
||||||
|
Normalized EBIT |
-453 |
59 |
-3 |
-16 |
-412 |
-3.4% |
||||||
|
Normalized EBITDA |
-320 |
58 |
-2 |
-16 |
-281 |
-4.9% |
Annex 2: Segment reporting (FY)
|
AB InBev Worldwide |
FY23 |
Scope |
Currency Translation |
Organic Growth |
FY24 |
Organic Growth |
||||||
|
Total volumes (thousand hls) |
584 728 |
-586 |
- |
-8 435 |
575 706 |
-1.4% |
||||||
|
of which AB InBev own beer |
505 899 |
-541 |
- |
-9 862 |
495 496 |
-2.0% |
||||||
|
Revenue |
59 380 |
777 |
-1 995 |
1 606 |
59 768 |
2.7% |
||||||
|
Cost of sales |
-27 396 |
-557 |
1 079 |
129 |
-26 744 |
0.5% |
||||||
|
Gross profit |
31 984 |
221 |
-916 |
1 735 |
33 024 |
5.4% |
||||||
|
SG&A |
-18 172 |
-343 |
543 |
-369 |
-18 341 |
-2.0% |
||||||
|
Other operating income/(expenses) |
778 |
31 |
-28 |
-2 |
779 |
-0.3% |
||||||
|
Normalized EBIT |
14 590 |
-91 |
-401 |
1 364 |
15 462 |
9.4% |
||||||
|
Normalized EBITDA |
19 976 |
-53 |
-589 |
1 624 |
20 958 |
8.2% |
||||||
|
Normalized EBITDA margin |
33.6% |
35.1% |
179bps |
|||||||||
|
|
||||||||||||
|
North America |
FY23 |
Scope |
Currency Translation |
Organic Growth |
FY24 |
Organic Growth |
||||||
|
Total volumes (thousand hls) |
90 140 |
-470 |
- |
-3 397 |
86 272 |
-3.8% |
||||||
|
Revenue |
15 072 |
-115 |
-18 |
-284 |
14 655 |
-1.9% |
||||||
|
Cost of sales |
-6 517 |
61 |
6 |
214 |
-6 236 |
3.3% |
||||||
|
Gross profit |
8 554 |
-53 |
-12 |
-69 |
8 419 |
-0.8% |
||||||
|
SG&A |
-4 619 |
7 |
7 |
247 |
-4 358 |
5.4% |
||||||
|
Other operating income/(expenses) |
34 |
- |
1 |
-28 |
7 |
-81.0% |
||||||
|
Normalized EBIT |
3 970 |
-47 |
-5 |
150 |
4 069 |
3.8% |
||||||
|
Normalized EBITDA |
4 727 |
-50 |
-6 |
120 |
4 791 |
2.5% |
||||||
|
Normalized EBITDA margin |
31.4% |
32.7% |
143bps |
|||||||||
|
Middle Americas |
FY23 |
Scope |
Currency Translation |
Organic Growth |
FY24 |
Organic Growth |
||||||
|
Total volumes (thousand hls) |
148 730 |
-18 |
- |
1 373 |
150 086 |
0.9% |
||||||
|
Revenue |
16 348 |
-29 |
-141 |
894 |
17 072 |
5.5% |
||||||
|
Cost of sales |
-6 379 |
1 |
48 |
88 |
-6 242 |
1.4% |
||||||
|
Gross profit |
9 969 |
-27 |
-94 |
982 |
10 830 |
9.9% |
||||||
|
SG&A |
-3 792 |
-19 |
34 |
-199 |
-3 976 |
-5.3% |
||||||
|
Other operating income/(expenses) |
51 |
- |
- |
-17 |
34 |
-33.0% |
||||||
|
Normalized EBIT |
6 228 |
-46 |
-59 |
766 |
6 889 |
12.3% |
||||||
|
Normalized EBITDA |
7 715 |
-69 |
-79 |
832 |
8 400 |
10.8% |
||||||
|
Normalized EBITDA margin |
47.2% |
49.2% |
239bps |
|||||||||
|
|
||||||||||||
|
South America |
FY23 |
Scope |
Currency Translation |
Organic Growth |
FY24 |
Organic Growth |
||||||
|
Total volumes (thousand hls) |
162 460 |
- |
- |
-1 692 |
160 768 |
-1.0% |
||||||
|
Revenue |
12 040 |
982 |
-1 200 |
602 |
12 423 |
5.0% |
||||||
|
Cost of sales |
-5 984 |
-627 |
613 |
-74 |
-6 073 |
-1.2% |
||||||
|
Gross profit |
6 056 |
354 |
-587 |
528 |
6 350 |
8.6% |
||||||
|
SG&A |
-3 575 |
-465 |
370 |
-108 |
-3 779 |
-2.9% |
||||||
|
Other operating income/(expenses) |
394 |
25 |
-27 |
60 |
452 |
17.1% |
||||||
|
Normalized EBIT |
2 875 |
-87 |
-244 |
480 |
3 024 |
17.1% |
||||||
|
Normalized EBITDA |
3 884 |
-13 |
-346 |
527 |
4 052 |
13.8% |
||||||
|
Normalized EBITDA margin |
32.3% |
32.6% |
267bps |
|
EMEA |
FY23 |
Scope |
Currency Translation |
Organic Growth |
FY24 |
Organic Growth |
||||||
|
Total volumes (thousand hls) |
90 213 |
- |
- |
3 591 |
93 804 |
4.0% |
||||||
|
Revenue |
8 589 |
16 |
-508 |
907 |
9 003 |
10.5% |
||||||
|
Cost of sales |
-4 645 |
-15 |
358 |
-376 |
-4 678 |
-8.1% |
||||||
|
Gross profit |
3 944 |
1 |
-150 |
530 |
4 325 |
13.4% |
||||||
|
SG&A |
-2 614 |
-47 |
86 |
-127 |
-2 701 |
-4.8% |
||||||
|
Other operating income/(expenses) |
198 |
4 |
-2 |
-23 |
177 |
-11.4% |
||||||
|
Normalized EBIT |
1 528 |
-42 |
-66 |
381 |
1 801 |
24.9% |
||||||
|
Normalized EBITDA |
2 570 |
-42 |
-121 |
440 |
2 847 |
17.1% |
||||||
|
Normalized EBITDA margin |
29.9% |
31.6% |
178bps |
|||||||||
|
|
||||||||||||
|
Asia Pacific |
FY23 |
Scope |
Currency Translation |
Organic Growth |
FY24 |
Organic Growth |
||||||
|
Total volumes (thousand hls) |
92 726 |
-75 |
- |
-8 255 |
84 397 |
-8.9% |
||||||
|
Revenue |
6 824 |
-12 |
-128 |
-487 |
6 196 |
-7.1% |
||||||
|
Cost of sales |
-3 272 |
-24 |
58 |
269 |
-2 970 |
8.2% |
||||||
|
Gross profit |
3 551 |
-36 |
-71 |
-218 |
3 227 |
-6.2% |
||||||
|
SG&A |
-2 133 |
-41 |
44 |
72 |
-2 059 |
3.4% |
||||||
|
Other operating income/(expenses) |
113 |
3 |
-2 |
3 |
116 |
2.2% |
||||||
|
Normalized EBIT |
1 531 |
-75 |
-29 |
-143 |
1 284 |
-9.6% |
||||||
|
Normalized EBITDA |
2 186 |
-81 |
-41 |
-131 |
1 933 |
-6.1% |
||||||
|
Normalized EBITDA margin |
32.0% |
31.2% |
35bps |
|||||||||
|
|
||||||||||||
|
Global Export and Holding Companies |
FY23 |
Scope |
Currency Translation |
Organic Growth |
FY24 |
Organic Growth |
||||||
|
Total volumes (thousand hls) |
459 |
-24 |
- |
-56 |
380 |
-12.8% |
||||||
|
Revenue |
508 |
-65 |
1 |
-26 |
418 |
-5.8% |
||||||
|
Cost of sales |
-598 |
47 |
-3 |
8 |
-546 |
1.5% |
||||||
|
Gross profit |
-90 |
-18 |
-2 |
-17 |
-128 |
-16.1% |
||||||
|
SG&A |
-1 439 |
223 |
3 |
-255 |
-1 468 |
-17.9% |
||||||
|
Other operating income/(expenses) |
-13 |
- |
2 |
3 |
-8 |
24.2% |
||||||
|
Normalized EBIT |
-1 542 |
205 |
2 |
-269 |
-1 604 |
-17.5% |
||||||
|
Normalized EBITDA |
-1 106 |
203 |
3 |
-165 |
-1 065 |
-14.8% |
Annex 3: Consolidated statement of financial position
|
Million US dollar |
31 December 2023 |
31 December 2024 |
||
|
ASSETS |
||||
|
Non-current assets |
||||
|
Property, plant and equipment |
26 818 |
23 503 |
||
|
Goodwill |
117 043 |
110 479 |
||
|
Intangible assets |
41 286 |
40 034 |
||
|
Investments in associates |
4 872 |
4 612 |
||
|
Investment securities |
178 |
168 |
||
|
Deferred tax assets |
2 935 |
2 493 |
||
|
Pensions and similar obligations |
12 |
42 |
||
|
Income tax receivables |
844 |
470 |
||
|
Derivatives |
44 |
261 |
||
|
Trade and other receivables |
1 941 |
1 577 |
||
|
Total non-current assets |
195 973 |
183 637 |
||
|
|
||||
|
Current assets |
||||
|
Investment securities |
67 |
221 |
||
|
Inventories |
5 583 |
5 020 |
||
|
Income tax receivables |
822 |
727 |
||
|
Derivatives |
505 |
554 |
||
|
Trade and other receivables |
6 024 |
5 270 |
||
|
Cash and cash equivalents |
10 332 |
11 174 |
||
|
Assets classified as held for sale |
34 |
33 |
||
|
Total current assets |
23 367 |
22 999 |
||
|
|
||||
|
Total assets |
219 340 |
206 637 |
||
|
|
||||
|
EQUITY AND LIABILITIES |
||||
|
Equity |
||||
|
Issued capital |
1 736 |
1 736 |
||
|
Share premium |
17 620 |
17 620 |
||
|
Reserves |
20 276 |
12 304 |
||
|
Retained earnings |
42 215 |
46 577 |
||
|
Equity attributable to equity holders of AB InBev |
81 848 |
78 237 |
||
|
|
||||
|
Non-controlling interests |
10 828 |
10 463 |
||
|
Total equity |
92 676 |
88 700 |
||
|
|
||||
|
Non-current liabilities |
||||
|
Interest-bearing loans and borrowings |
74 163 |
70 720 |
||
|
Pensions and similar obligations |
1 673 |
1 296 |
||
|
Deferred tax liabilities |
11 874 |
11 321 |
||
|
Income tax payables |
589 |
284 |
||
|
Derivatives |
151 |
68 |
||
|
Trade and other payables |
738 |
797 |
||
|
Provisions |
320 |
385 |
||
|
Total non-current liabilities |
89 508 |
84 871 |
||
|
|
||||
|
Current liabilities |
||||
|
Bank overdrafts |
17 |
- |
||
|
Interest-bearing loans and borrowings |
3 987 |
1 449 |
||
|
Income tax payables |
1 583 |
1 805 |
||
|
Derivatives |
5 318 |
5 817 |
||
|
Trade and other payables |
25 981 |
23 804 |
||
|
Provisions |
269 |
191 |
||
|
Total current liabilities |
37 156 |
33 066 |
||
|
|
||||
|
Total equity and liabilities |
219 340 |
206 637 |
Annex 4: Consolidated statement of cash flows
|
For the year ended 31 December |
||||
|
Million US dollar |
2023 |
2024 |
||
|
OPERATING ACTIVITIES |
||||
|
Profit of the period |
6 891 |
7 416 |
||
|
Depreciation, amortization and impairment |
5 411 |
5 544 |
||
|
Net finance cost/(income) |
5 102 |
5 353 |
||
|
Equity-settled share-based payment expense |
570 |
644 |
||
|
Income tax expense |
2 234 |
3 152 |
||
|
Other non-cash items |
1 125 |
-269 |
||
|
Share of result of associates |
-260 |
-433 |
||
|
Cash flow from operating activities before changes in working capital and use of provisions |
21 072 |
21 406 |
||
|
Decrease/(increase) in trade and other receivables |
-1 147 |
341 |
||
|
Decrease/(increase) in inventories |
717 |
-149 |
||
|
Increase/(decrease) in trade and other payables |
-1 110 |
-215 |
||
|
Pension contributions and use of provisions |
-419 |
-374 |
||
|
Cash generated from operations |
19 113 |
21 009 |
||
|
Interest paid |
-3 877 |
-3 649 |
||
|
Interest received |
598 |
594 |
||
|
Dividends received |
127 |
234 |
||
|
Income tax paid |
-2 696 |
-3 134 |
||
|
Cash flow from/(used in) operating activities |
13 265 |
15 055 |
||
|
INVESTING ACTIVITIES |
||||
|
Acquisition of property, plant and equipment and of intangible assets |
-4 638 |
-3 863 |
||
|
Proceeds from sale of property, plant and equipment and of intangible assets |
156 |
128 |
||
|
Sale/(acquisition) of subsidiaries, net of cash disposed/ acquired of |
9 |
-46 |
||
|
Proceeds from sale/(acquisition) of other assets |
83 |
523 |
||
|
Cash flow from/(used in) investing activities |
-4 390 |
-3 259 |
||
|
FINANCING ACTIVITIES |
||||
|
Proceeds from borrowings |
202 |
5 465 |
||
|
Repayments of borrowings |
-3 098 |
-9 295 |
||
|
Dividends paid |
-3 013 |
-2 672 |
||
|
Share buyback |
-362 |
-937 |
||
|
Payment of lease liabilities |
-780 |
-787 |
||
|
Derivative financial instruments |
-841 |
-431 |
||
|
Sale/(acquisition) of non-controlling interests |
-22 |
-435 |
||
|
Other financing cash flows |
-646 |
-763 |
||
|
Cash flow from/(used in) financing activities |
-8 560 |
-9 854 |
||
|
Net increase/(decrease) in cash and cash equivalents |
315 |
1 942 |
||
|
Cash and cash equivalents less bank overdrafts at beginning of year |
9 890 |
10 314 |
||
|
Effect of exchange rate fluctuations |
109 |
-1 082 |
||
|
Cash and cash equivalents less bank overdrafts at end of period |
10 314 |
11 174 |
Contacts
Investors
Shaun Fullalove
E-mail: shaun.fullalove@ab-inbev.com
Ekaterina Baillie
E-mail: ekaterina.baillie@ab-inbev.com
Cyrus Nentin
E-mail: cyrus.nentin@ab-inbev.com
Media
Media Relations
E-mail: media.relations@ab-inbev.com
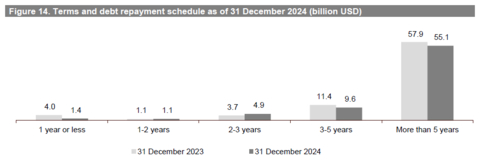
Figure 14. Terms and debt repayment schedule as of 31 December 2024 (billion USD) (Graphic: Business Wire)
【你點睇?】新一份預算案公布,多項開源節流措施推出,你認為哪一項措施最能達致改善政府財赤目標?► 立即投票